


Introduction
Have you heard the term flowchart in discussion or perhaps have even seen them, but you're not really sure what they are? Then this blog is for you!
A flowchart is a visual representation of a process, system, or algorithm. Flowcharts use symbols like rectangles, diamonds, and arrows to depict the steps, decisions, and possible outcomes involved. Think of it like a roadmap that helps you understand the "big picture" and navigate the details of a process.
Flowcharts are powerful tools for understanding, communicating, optimizing, and documenting processes.
Flowcharts are powerful tools that can be used to understand, communicate, optimize, and document processes. They're used in a variety of fields, including business operations, software development, project management, and personal planning.
Whether you're looking to improve communication, efficiency, or clarity in your work, flowcharts can be your secret weapon for clarity and efficiency. Read on to learn the core components, types and how to make a flowchart.
TL;DR: What is a flowchart?
- A flowchart is a visual representation of a process using symbols like rectangles and arrows.
- It helps understand, communicate, optimize, and document processes in various fields.
- Flowcharts have key symbols like rectangles, diamonds, ovals, and arrows.
- Different types of flowcharts include decision, process, and data flowcharts.
- To create a flowchart, determine the type, choose a tool, define scope, identify key steps, pick symbols, and make connections.
What is a flowchart?
A flowchart is a diagram that represents a workflow, process, or structure using recognizable shapes, such as rectangles, diamonds, and arrows to improve understanding of complex topics.
What is the purpose of a flowchart?
The main purpose of a flowchart is to communicate complex workflows in a digestible format that can be universally understood. These tools help people understand the steps they need to take, simplify complicated information, and enable faster communication of complex ideas.
What's the history of a flowchart?
Flowcharts made their debut in the 1920s as “flow process charts.” These charts were used by industrial engineers to present simplified views of processes on the assembly lines. Today, flowcharts are used across all industries to empower people to do their best work with clarity and efficiency.
Flowchart symbols
 |
Now that we understand the purpose of a flowchart, let's dive into how it works.
Flowcharts consist of main symbols that all have a purpose in the chart. Each symbol describes the type of function that the flowchart viewer will have to take at that point in the flowchart.
While there are dozens of symbols flowchart builders can use, there are four main flowchart symbols that you will see on every flowchart.
1. Rectangle
The first is the rectangle. Rectangles in flowcharts represent a process. When you see a rectangle on a flowchart, you can assume there is a specific process that you will have to follow at that step.
2. Diamond
Up next is the diamond. Diamonds represent a moment where you'll have to make a decision, or that there's an element of the situation that could affect the outcome.
This decision or element could be a simple one or a complex one, but seeing the diamond can help you prepare for this moment with clarity.
3. Oval
Ovals are one of the most important flowchart shapes. Ovals represent the start of the workflow and the end of the workflow. They help you understand the current state and the ideal end of the entire process.
4. Arrows
Finally, arrows are the connecting pieces of the flowchart. Arrows piece together the processes, decisions, and start/end points with a sense of direction. These arrows allow flowcharts to depict a clear order of steps so that there is no confusion.
| Symbol | Name | Function |
|---|---|---|
| Oval | Terminator | A start or endpoint |
| Arrows | Flowline | Shows the direction of the flow between different symbols |
| Rectangle | Process | A single step, action or task |
| Diamond | Decision | A decision point |
| Circle | Connector | Connects different parts of the flowchart |
| Parallelogram | Input/Output | Data entering or leaving |
Types of flowcharts
Flowcharts can be built for a multitude of use cases — to help make decisions, articulate business processes, showcase data, or more!
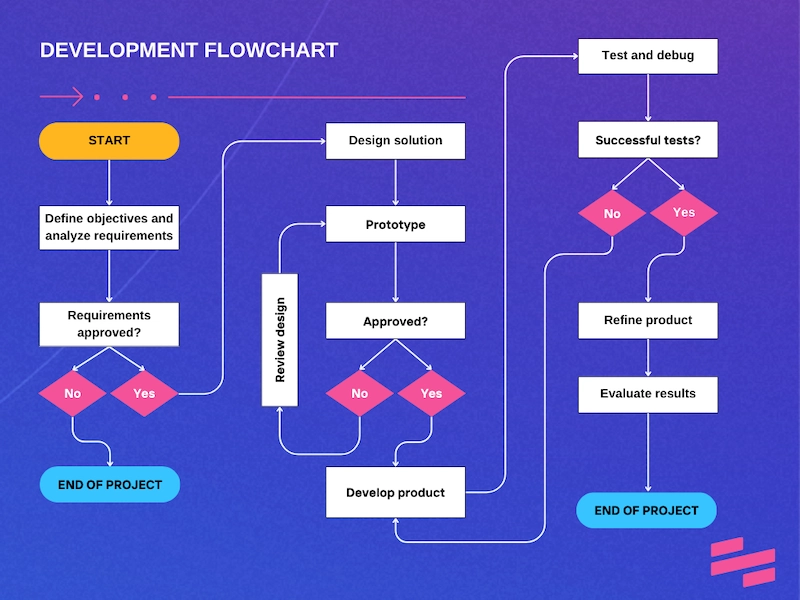
1. Decision flowchart
 |
When it comes to showing people how you make decisions and what you think about during those decisions, nothing is more helpful than a decision flowchart. These charts help make it clear and simple for you or almost any user what decisions need to be made in a specific process.
With yes or no questions, these flowcharts walk the viewer through a series of moments in a situation that could be common at your organization. These yes and no questions drive you from a beginning point to an end point.
2. Process flowchart
 |
While a decision flowchart shows moments to make a choice in a process, a process flowchart shows how a variety of activities are connected.
In order to end up with a specific endpoint or result, these activities have to happen in the same way. Business process flow charts help you understand the scope of the work and guide you if you are stuck in the process.
💡 Learn how process flow templates can standardize and streamline your complex workflows.
3. Data flowcharts
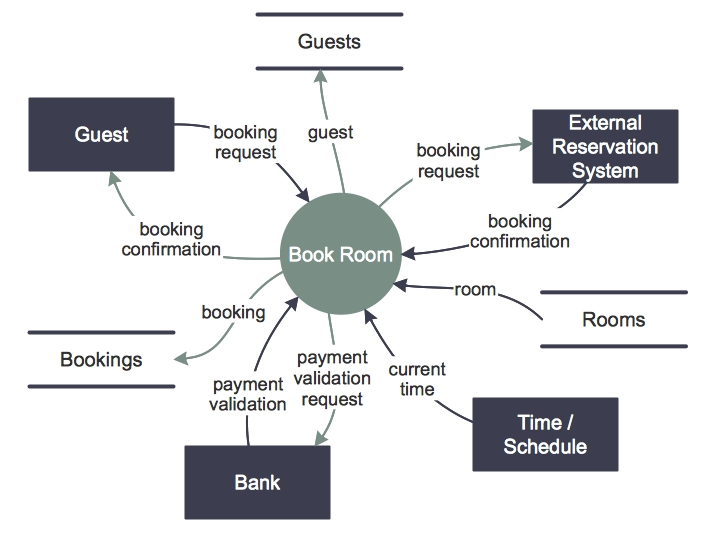 |
Data flowcharts showcase where and how your team’s data live and move throughout different databases or sources. These flowcharts ensure there is clarity and understanding across all teams on how data comes together.
Avoid confusion about where data lives by creating a flowchart like this.
While these three are just a few examples, flowcharts can come in all shapes and sizes, including:
- Program flowcharts.
- Logic flowcharts.
- System flowcharts.
- Swimlane flowcharts.
- Workflow flowcharts.
- Business process flow diagrams.
- And so much more.
The type of flowchart you choose is dependent on your industry, type of work, and the goal of the flowchart itself.
📌 Related resource: How to Build a Sales Process Flowchart
How to plan and draw a basic flowchart
Now that you know the elements of a flowchart and how they play a role in creating the different types of flowcharts, let’s learn how to create one.
Step 1: Determine the type of flowchart
The first step would be to determine the type of flowchart you’re looking to create. Ask yourself:
- How complicated is the process we’re trying to convey?
- Who is going to be using the flowchart?
From there, you should be able to determine if you will be creating a decision, process, data, or another type of flowchart.
Step 2: Choose how you will build your flowchart
Once you’ve decided what you want to build, you'll have to determine how you want to build it. There are many options for creating a flowchart like LucidChart, Miro or Draw.io. Choosing a user-friendly drag-and-drop interface to quickly add shapes, lines, and connectors can empower you to build your own flowchart.
Be sure the flowcharts are accurate and aesthetically appealing with these tools before shipping them to your team. Whether they are for colleagues, clients, or stakeholders, the flowchart should make complex processes more digestible.
Step 3: Define the scope of your flowchart
Once you’ve determined the type of flowchart you want to create and the tool you want to use, you can start defining the scope of your flowchart.
In this phase, decide your chart's start and end points and the ideal outcome for the viewer. Do you want them to:
- Follow each step one by one?
- Understand a process at a glance?
This will help you decide how the flowchart will be built.
Step 4: Identify key steps
Next, take time to identify the key steps in the flowchart you are building.
When writing them into your flowchart, make sure that the steps are clear and written in easy-to-understand language to avoid any confusion.
Understanding what steps you want to include and how many you want to include will ultimately decide the layout of your flowcharts.
Step 5: Pick your symbols
Now that you have the steps, you need to choose the appropriate symbols that will convey those steps.
Remind yourself of the meanings of each symbol by scrolling up in this blog post or researching more symbols that may be effective in your flowcharts.
Step 6: Make the connections
The last step is connecting each symbol/step in a logical way.
When connecting the steps, you may realize that the connection from one step to the other may seem a bit vague. It is key to add a step in this situation to prevent any confusion from flowchart viewers.
You may also find it helpful to remove a step if it is redundant. Ultimately, it has to work for you and the people who will use it.
Simplify the flowchart creation process with process documentation
Process documentation acts as a solid foundation for creating accurate, informative, and valuable flowcharts. Here's how process documentation can help you build flowcharts:
1. Define the scope
When building flow charts, you want to make sure everyone on your team is speaking the same language.
When documenting your process, you outline the:
- Steps.
- Initial point.
- Endpoint.
- Participants in the process.
This enables you and your team to have extreme clarity in who does what and how a flowchart should be scoped Process documentation makes sure your essential elements are in place before you start.
2. Enhance clarity
Documenting these steps in a clear and actionable way for you and your team ensures that everyone involved has the same understanding of the process, leading to a more accurate and consistent flowchart representation.
Process documentation = fewer questions and a lot more clear communication.
3. Identify key steps and decisions
When working on this important documentation, decide what steps are key steps and align on them early.
Having detailed process documentation with very clear important steps dissects the process into smaller, manageable steps for your whole team. This makes it easier to identify the:
- Logical sequence of steps.
- Key decision points.
- Actions.
- Decision points in the flowchart.
Process documentation can serve as a source of annotations and explanations for the flowchart, adding context and detail for further understanding. Once you do this work, it can be used as a template for future flowcharts — saving time and effort.
While it can seem like an extra step, the secret to your success is automating your process documentation.
Automate process documentation with Scribe
 |
Scribe makes it easy to turn complex procedures into visually engaging, easy-to-follow instructions and to document your process meaningfully.
With Scribe, you can auto-generate process documentation while you work, and build clear, visual step-by-step guides to serve as a solid foundation for building your flowcharts.
Click "Start Capture" and follow the steps you normally do, then stop capturing and boom — you have a clear and easy-to-understand guide.
Here's a Scribe in action:
 |
You can review the guide to ensure it accurately reflects your process, and if any tweaks or additions are needed, effortlessly customize it.
Use Scribe Pages to combine multiple Scribes, add videos, images, GIFs and more. You can even ask the AI to turn your guides into any kind of written document.
 |
Last but not least, you can quickly and easily share the Scribe link with team members who want to learn about your process.
Our customers agree — Chris Orsinger wrote:
"Easy learning curve — you get the hang of it in minutes. Scribe auto-generates all key steps and supporting visuals. Teammates love receiving these — it helps them adopt new streamlined processes, work more efficiently, and clearly understand directions — right away!"
Wrapping up: What is a flowchart?
Flowcharts are a fantastic visual tool, which can help in understanding, communicating, optimizing, and documenting processes. Whether you're working in business operations, software development, project management, or personal planning, flowcharts can help you better understand, convey, refine, and capture procedures. So if you're looking to boost clarity, productivity, and collaboration, learning to use flowcharts is an invaluable skill.
With Scribe, you can easily turn complex procedures into visually engaging, easy-to-follow instructions in seconds. Build a solid foundation for creating accurate and informative flowcharts in seconds with Scribe!
Happy flowcharting!


